Table of Contents
Node-Red
In Node-Red we can now subscribe to the data from the TerraControl Node.
Lets first start Node-Red by browsing to http://<ip address of raspberry pi>:1880
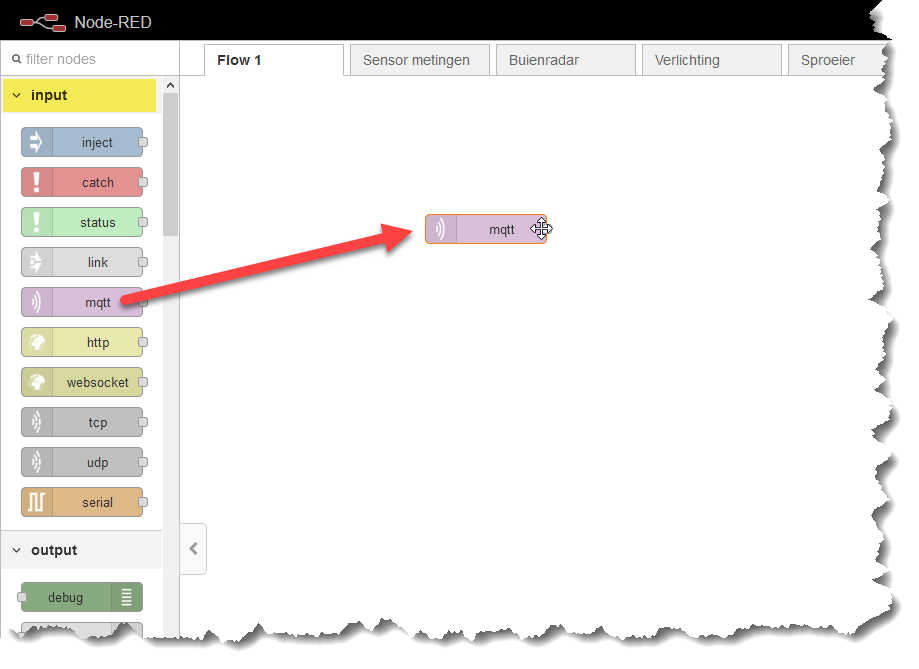
On the left side of the screen are a lot of possible nodes visible. Pick the mqtt node from the input category and drag it onto the main area:
Double click on the mqtt node to open it’s settings.
Create a new Server using the IP address of the Raspberry Pi (assuming that the MQTT broker is running on the Raspberry Pi) and give it a recognizable name.
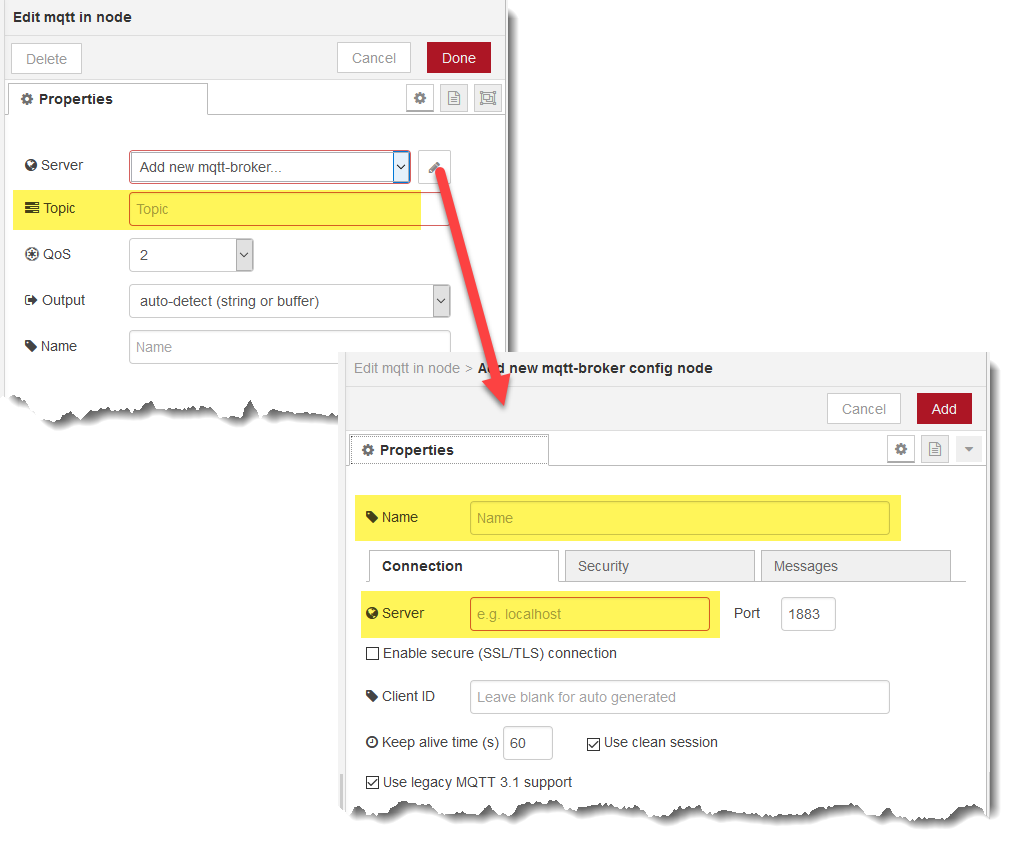
And use outTopic as topic because in main.cpp on the Wemos the mqtt message is sent as topic outTopic: client.publish("outTopic",msg );
Make sure output is set to a parsed JSON object, this ensures that the data is received as data instead of a long line of text.
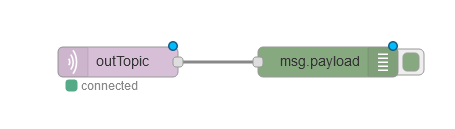
In the output category is a debug node. Drag it into the work area and connect the two nodes:
Press the Deploy button on the upper right corner of Node-Red to make this flow active.
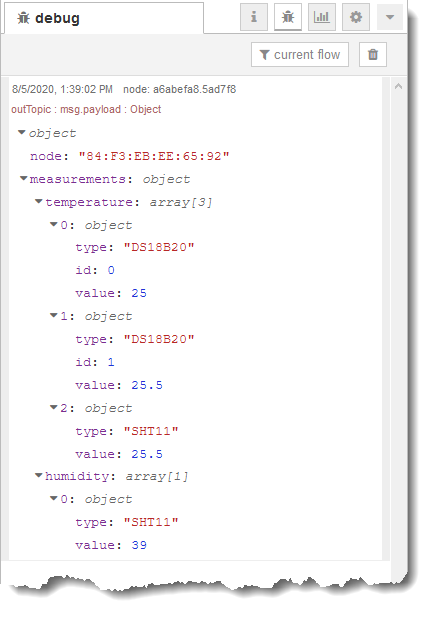
Now find the Debug window en see if the mqtt data is being received:
The next obvious thing to do is create a graph that shows the temperatures and humidity.
Add a function node (function category) and a chart node (dashboard category).
Edit the function node and use the code below as function:
var dataDS18B20_0 = {};
var dataDS18B20_1 = {};
var dataSHT11 = {};

dataDS18B20_0.payload = msg.payload.measurements.temperature[0].value;
dataDS18B20_0.topic="DS18B20[0]";

dataDS18B20_1.payload = msg.payload.measurements.temperature[1].value;
dataDS18B20_1.topic="DS18B20[1]";

dataSHT11.payload = msg.payload.measurements.temperature[2].value;
dataSHT11.topic="SHT11";

return [dataDS18B20_0, dataDS18B20_1, dataSHT11];
And make sure the Outputs are set to 3 at the bottom of the Edit function node dialog.
In the settings for the chart node you can create a new tab and a new group or pick an existing one.
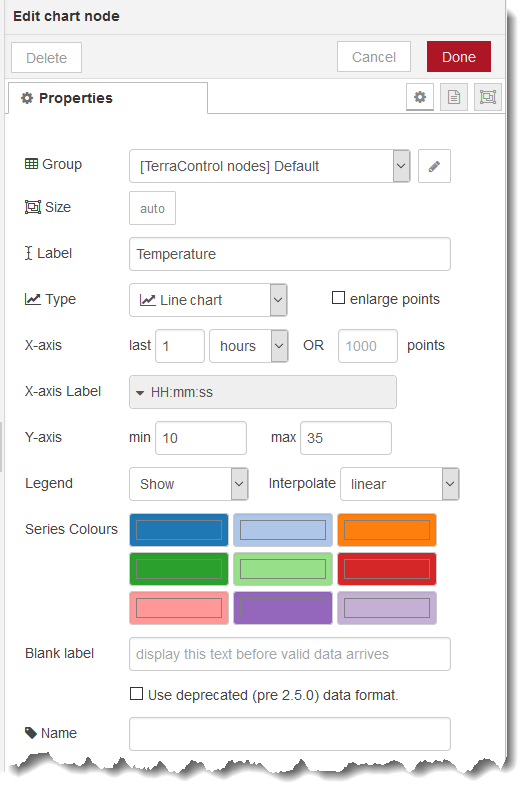
After the 2 nodes are configured they can be connected as follows:
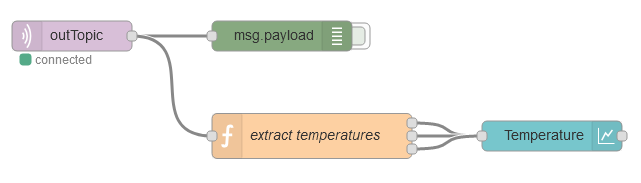
Deploy the flow and browse to http://<ip address of raspberry pi>:1880/ui to display the Node-Red dashboard:
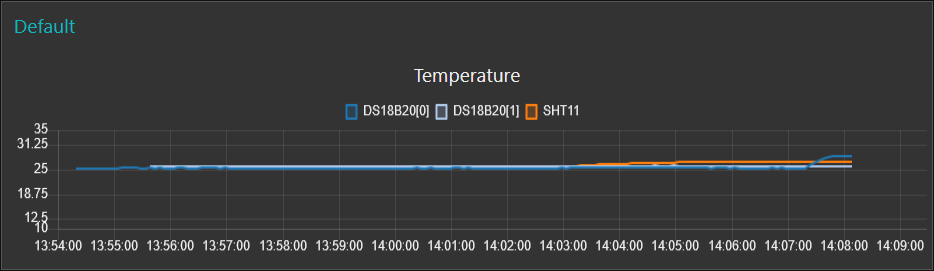
Maybe the size of the graph is very small, this depends on the settings in Node-Red. These settings are located on the Dashboard dialog on the right hand side of the working area:
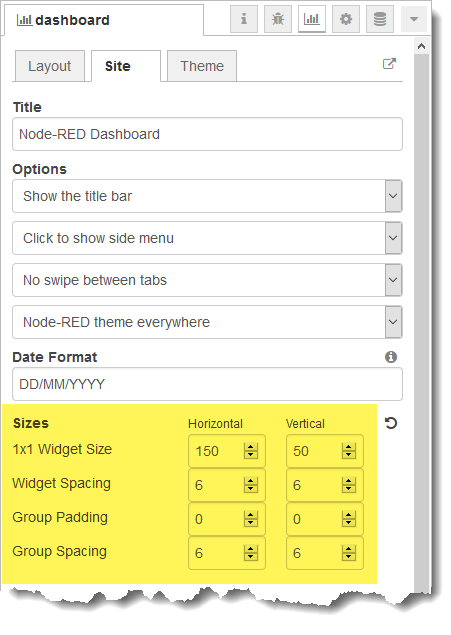
Additional information about charts can be found in the many Node-Red tutorials on the internet such as this one.